|
|
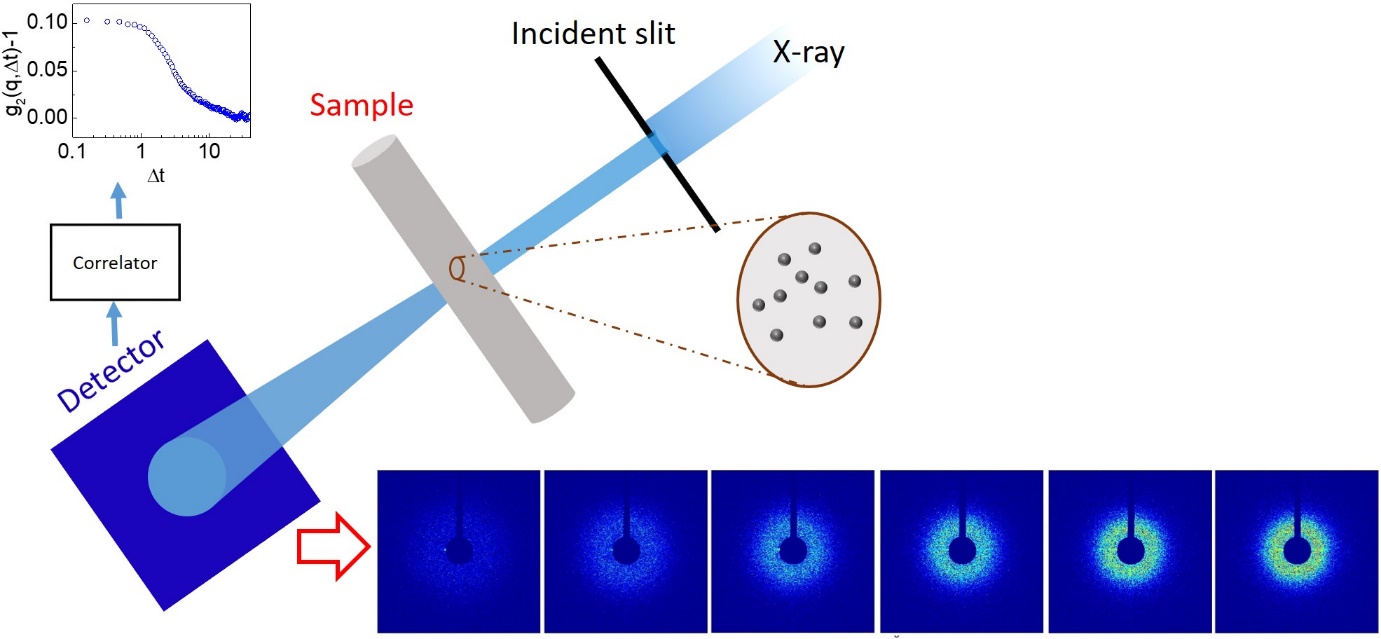
When a coherent beam (parallel and no frequency distribution)
falls on an object with static or dynamic disorder, a random array
of bright and dark spots are created by the irregular interference
of scattered waves from different parts of the object. This is
called speckle pattern. As the scattering parts fluctuate (due to
dynamics), the speckle pattern also fluctuates. By probing such
fluctuations, it is possible to obtain the information about the
sample dynamics. X-ray photon correlation spectroscopy (XPCS)
exploits this mechanism to study the dynamics using a high
brilliance synchrotron X-ray source. In this technique, a series of
images are collected over time using an area detector which records
intensity fluctuations in q-space (reciprocal space, i.e. length
scale, L ~ 2 π/q) with time as schematically shown in Figure
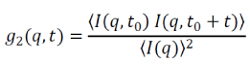
1. Such an intensity fluctuation can be quantified by the intensity
auto-correlation function (ICF)
|
In many cases g2(q,t) can be described by an exponential decay function
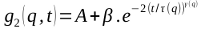
Where, τ is the characteristic relaxation time, β is the
scattering contrast, and γ is the stretching exponent called
Kohlrausch-Williams-Watts (KWW) exponent. γ = 1 stands for a
simple diffusive dynamics, and γ> 1 indicates a compressed
exponential decay, and γ < 1 stands for the slower dynamics
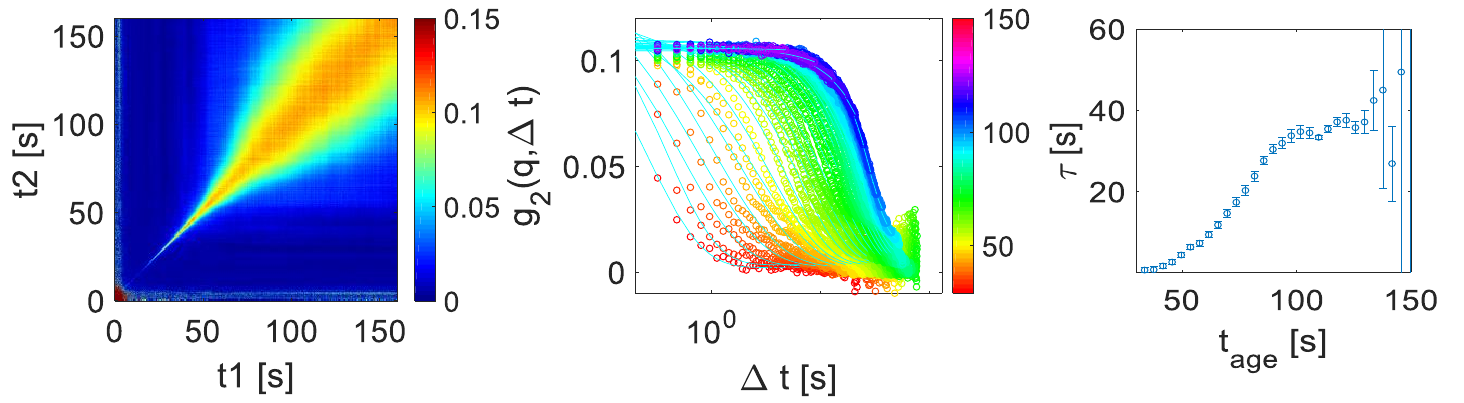
than diffusion. In the case of a non-equilibrium, such ICF can be
obtained as a function of time which is presented in terms of two
time correlation function (TTC) given by
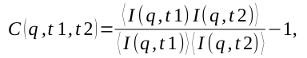
where the average is over image pixels of the detector. C measures
the evolution of ICF along the time tage =
(t1+t2)/2. A typical TTC is shown in the left
panel of Figure TTC. The width of the bright part along
tage (diagonal direction) is proportional to the
relaxation time at that tage. The change in width
indicates the dynamical heterogeneity of the system. In this case,
the heterogeneity can be quantified by a higher order correlation
function, χT which is given by
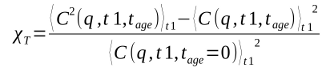
χT peaks around the inflection point of
g2. χT corresponding to the dynamics shown in the
left panel (Figure 2) is show in the right panel of Figure 2. Here,
the maximum value of χT gives the variance of
relaxation time and hence the degree of heterogeneity. On the other
hand, the value, t at χT(max) provides the estimation
of length-scale corresponding to the spatial heterogeneity.
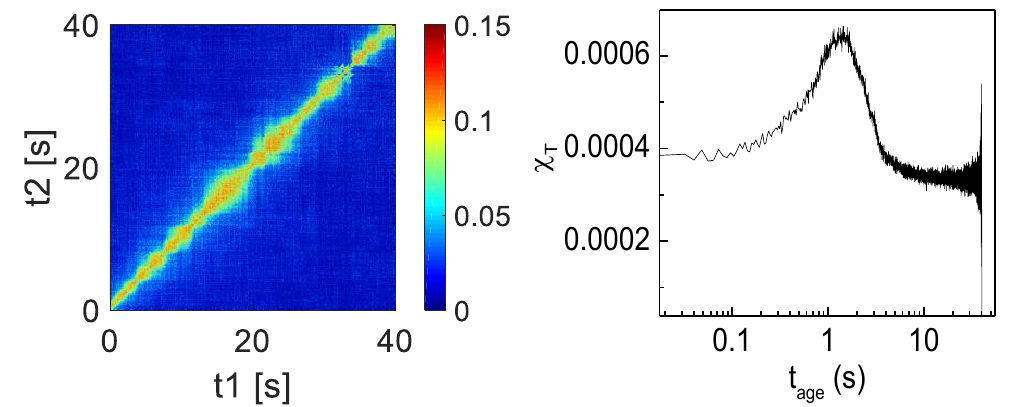
Figure 2: (Left): A time correlation function (TTC), and (right):
χT showing dynamical heterogeneity
|