Quasi-Elastic Neutron Scattering (QENS)

Basic Principles

In a typical neutron scattering experiment, the most important ingredients are:

  • The incoming neutrons, with wave vector k = 2π/ λ, with the unit vector pointing in the direction of k and the wavelength λ;
  • The sample, i.e. the scatterer;
  • The scattered neutrons, with new wave vector k'. In principle, k' differs from k in both the magnitude | k' | and direction. The angle formed by these two vectors is defined as 2θ.

In QENS, the incoming neutrons have a kinetic energy of the order of 25 meV (thermal neutrons) or lower (cold neutrons), and the amount of energy transferred during a scattering event ranges from less than 1 μeV to ca. 100 μeV. Thus, although the incoming neutron can lose or gain energy from the interaction with the sample (inelastic scattering), the amount of such energy transfer ΔE = ℏω is sufficiently small to make the so-called elastic approximation. Consequently, the magnitude of the scattering vector q, defined as difference between outgoing and incoming wave vector, can be safely approximated to

scattering vector

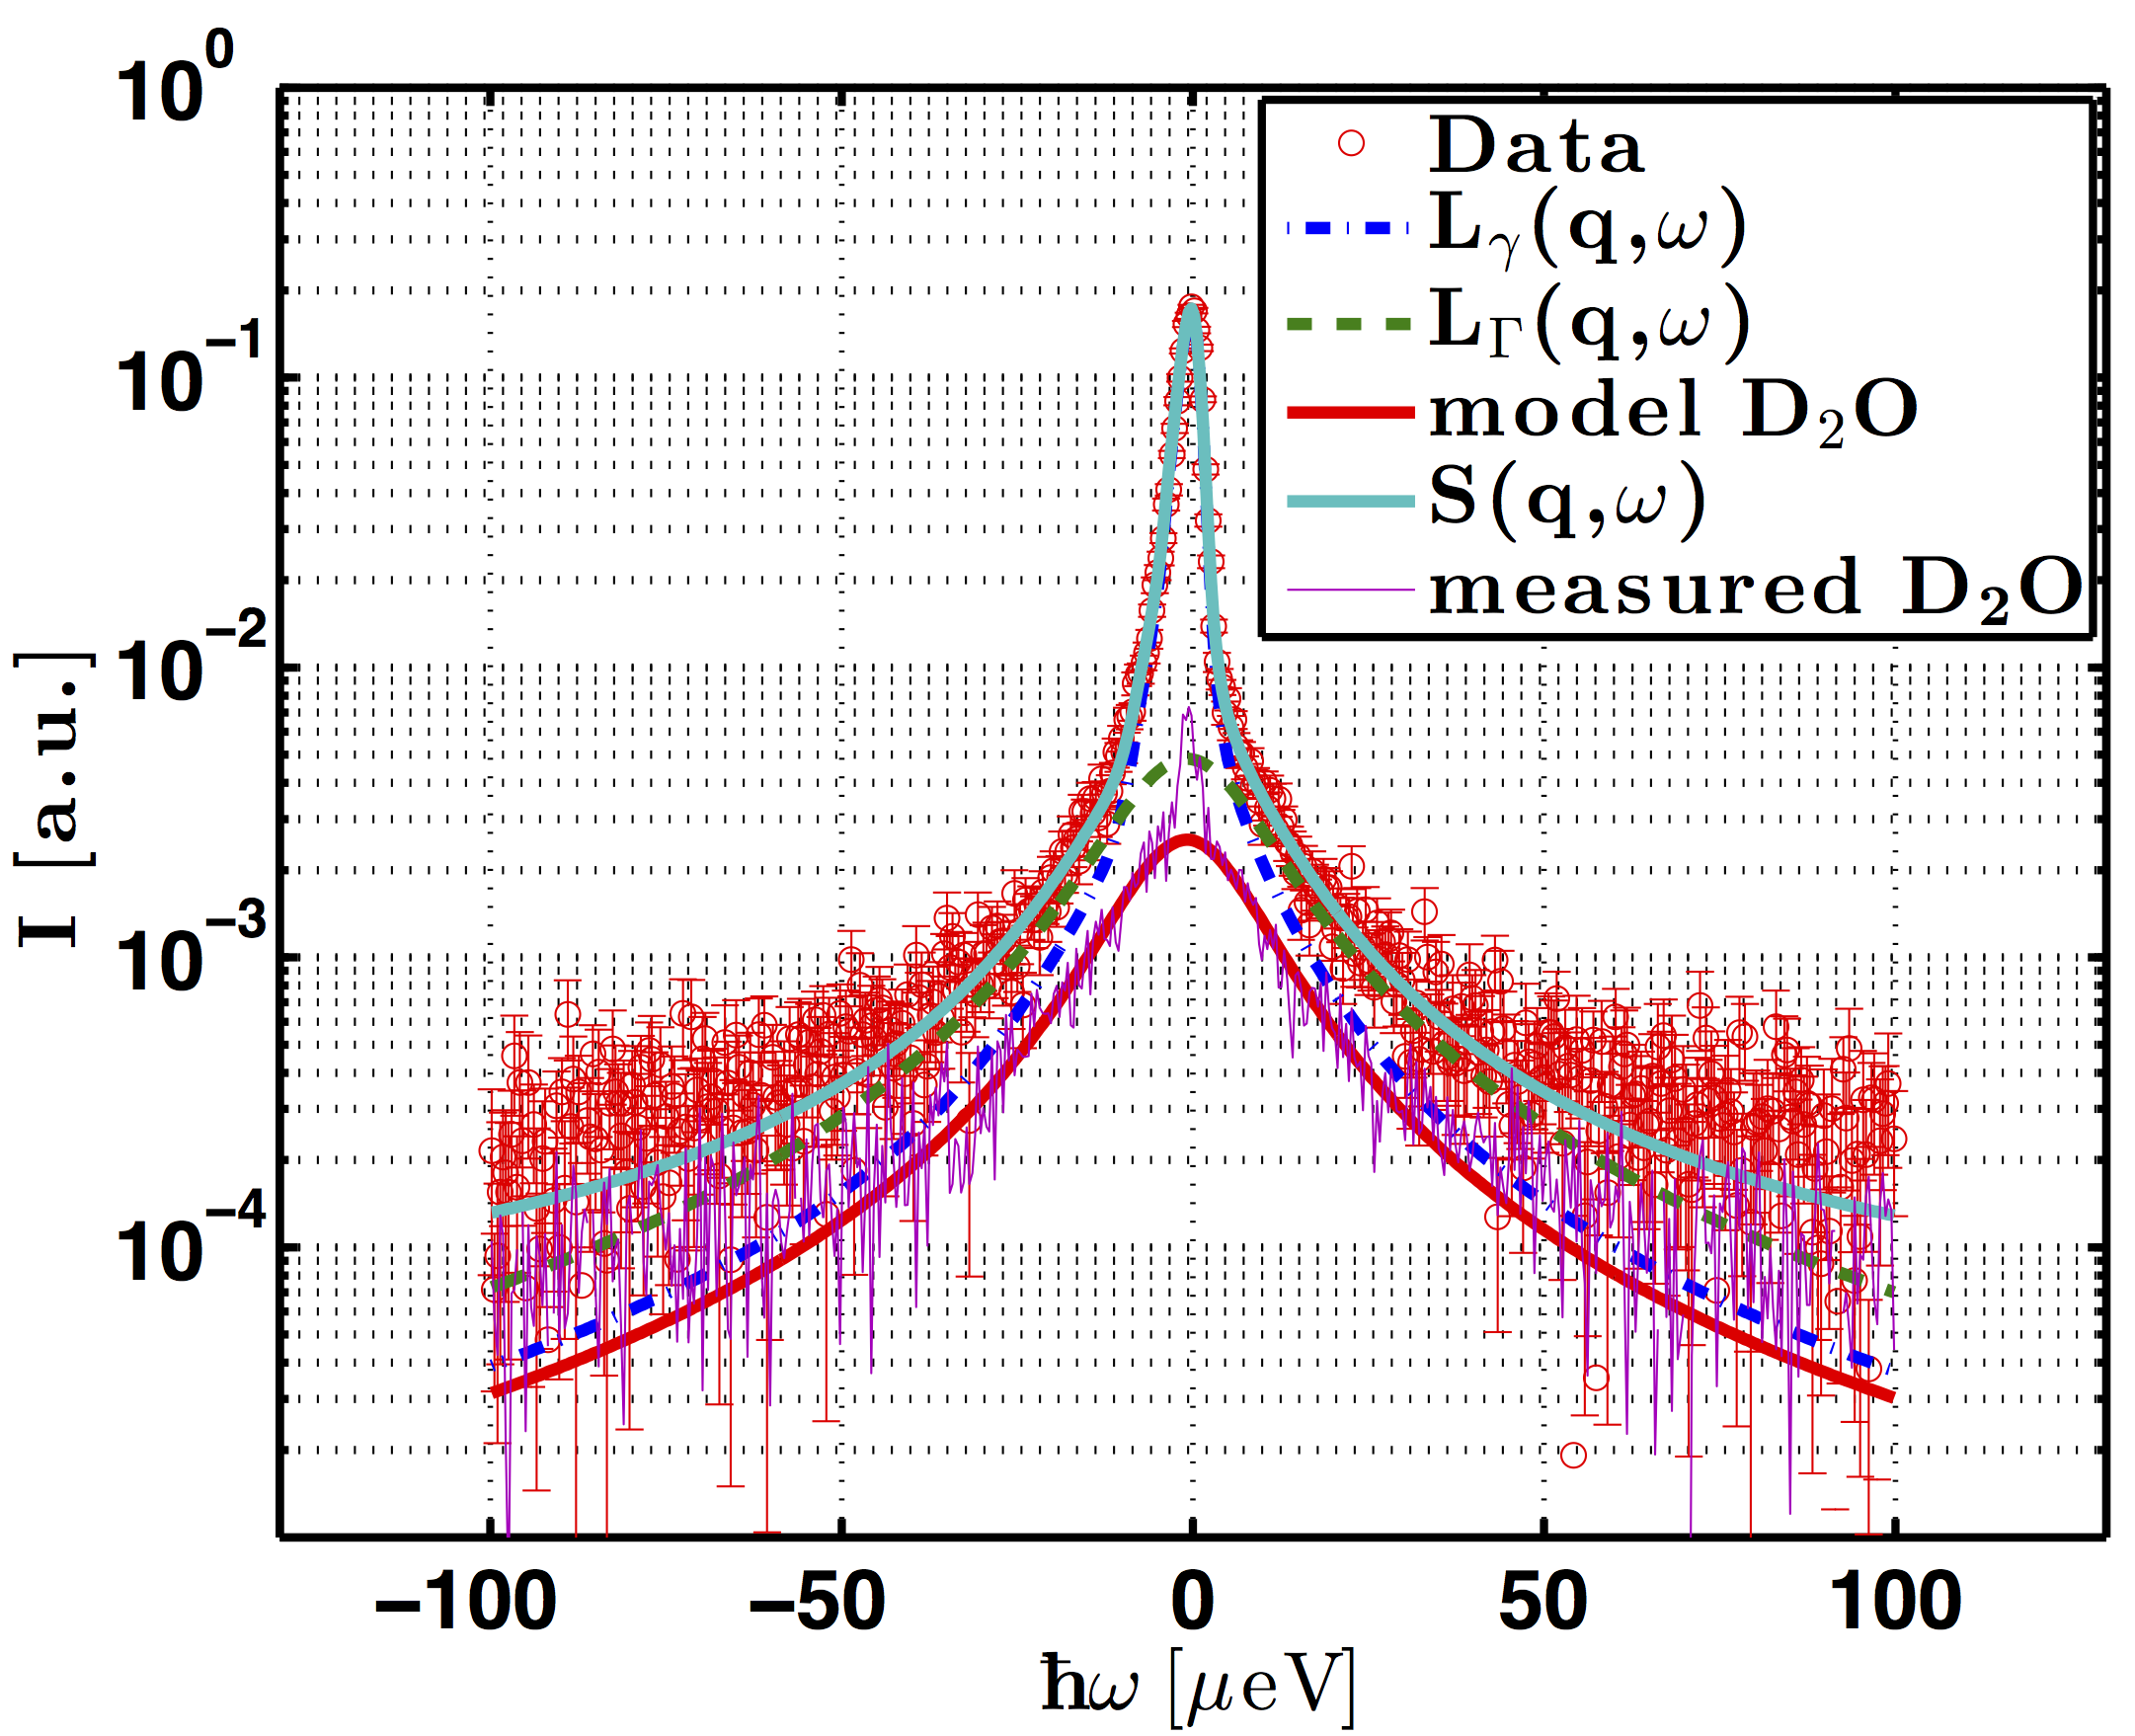
A QENS measurement consists thus in counting the number of neutrons scattered as a function of the energy transfer ℏω and scattering vector q (i.e. recording a series of spectra, see Examples). Such spectra can then be related to the diffusion constant D of the particles within the sample by fitting them with the Lorentzian function

scattering vector
q vector

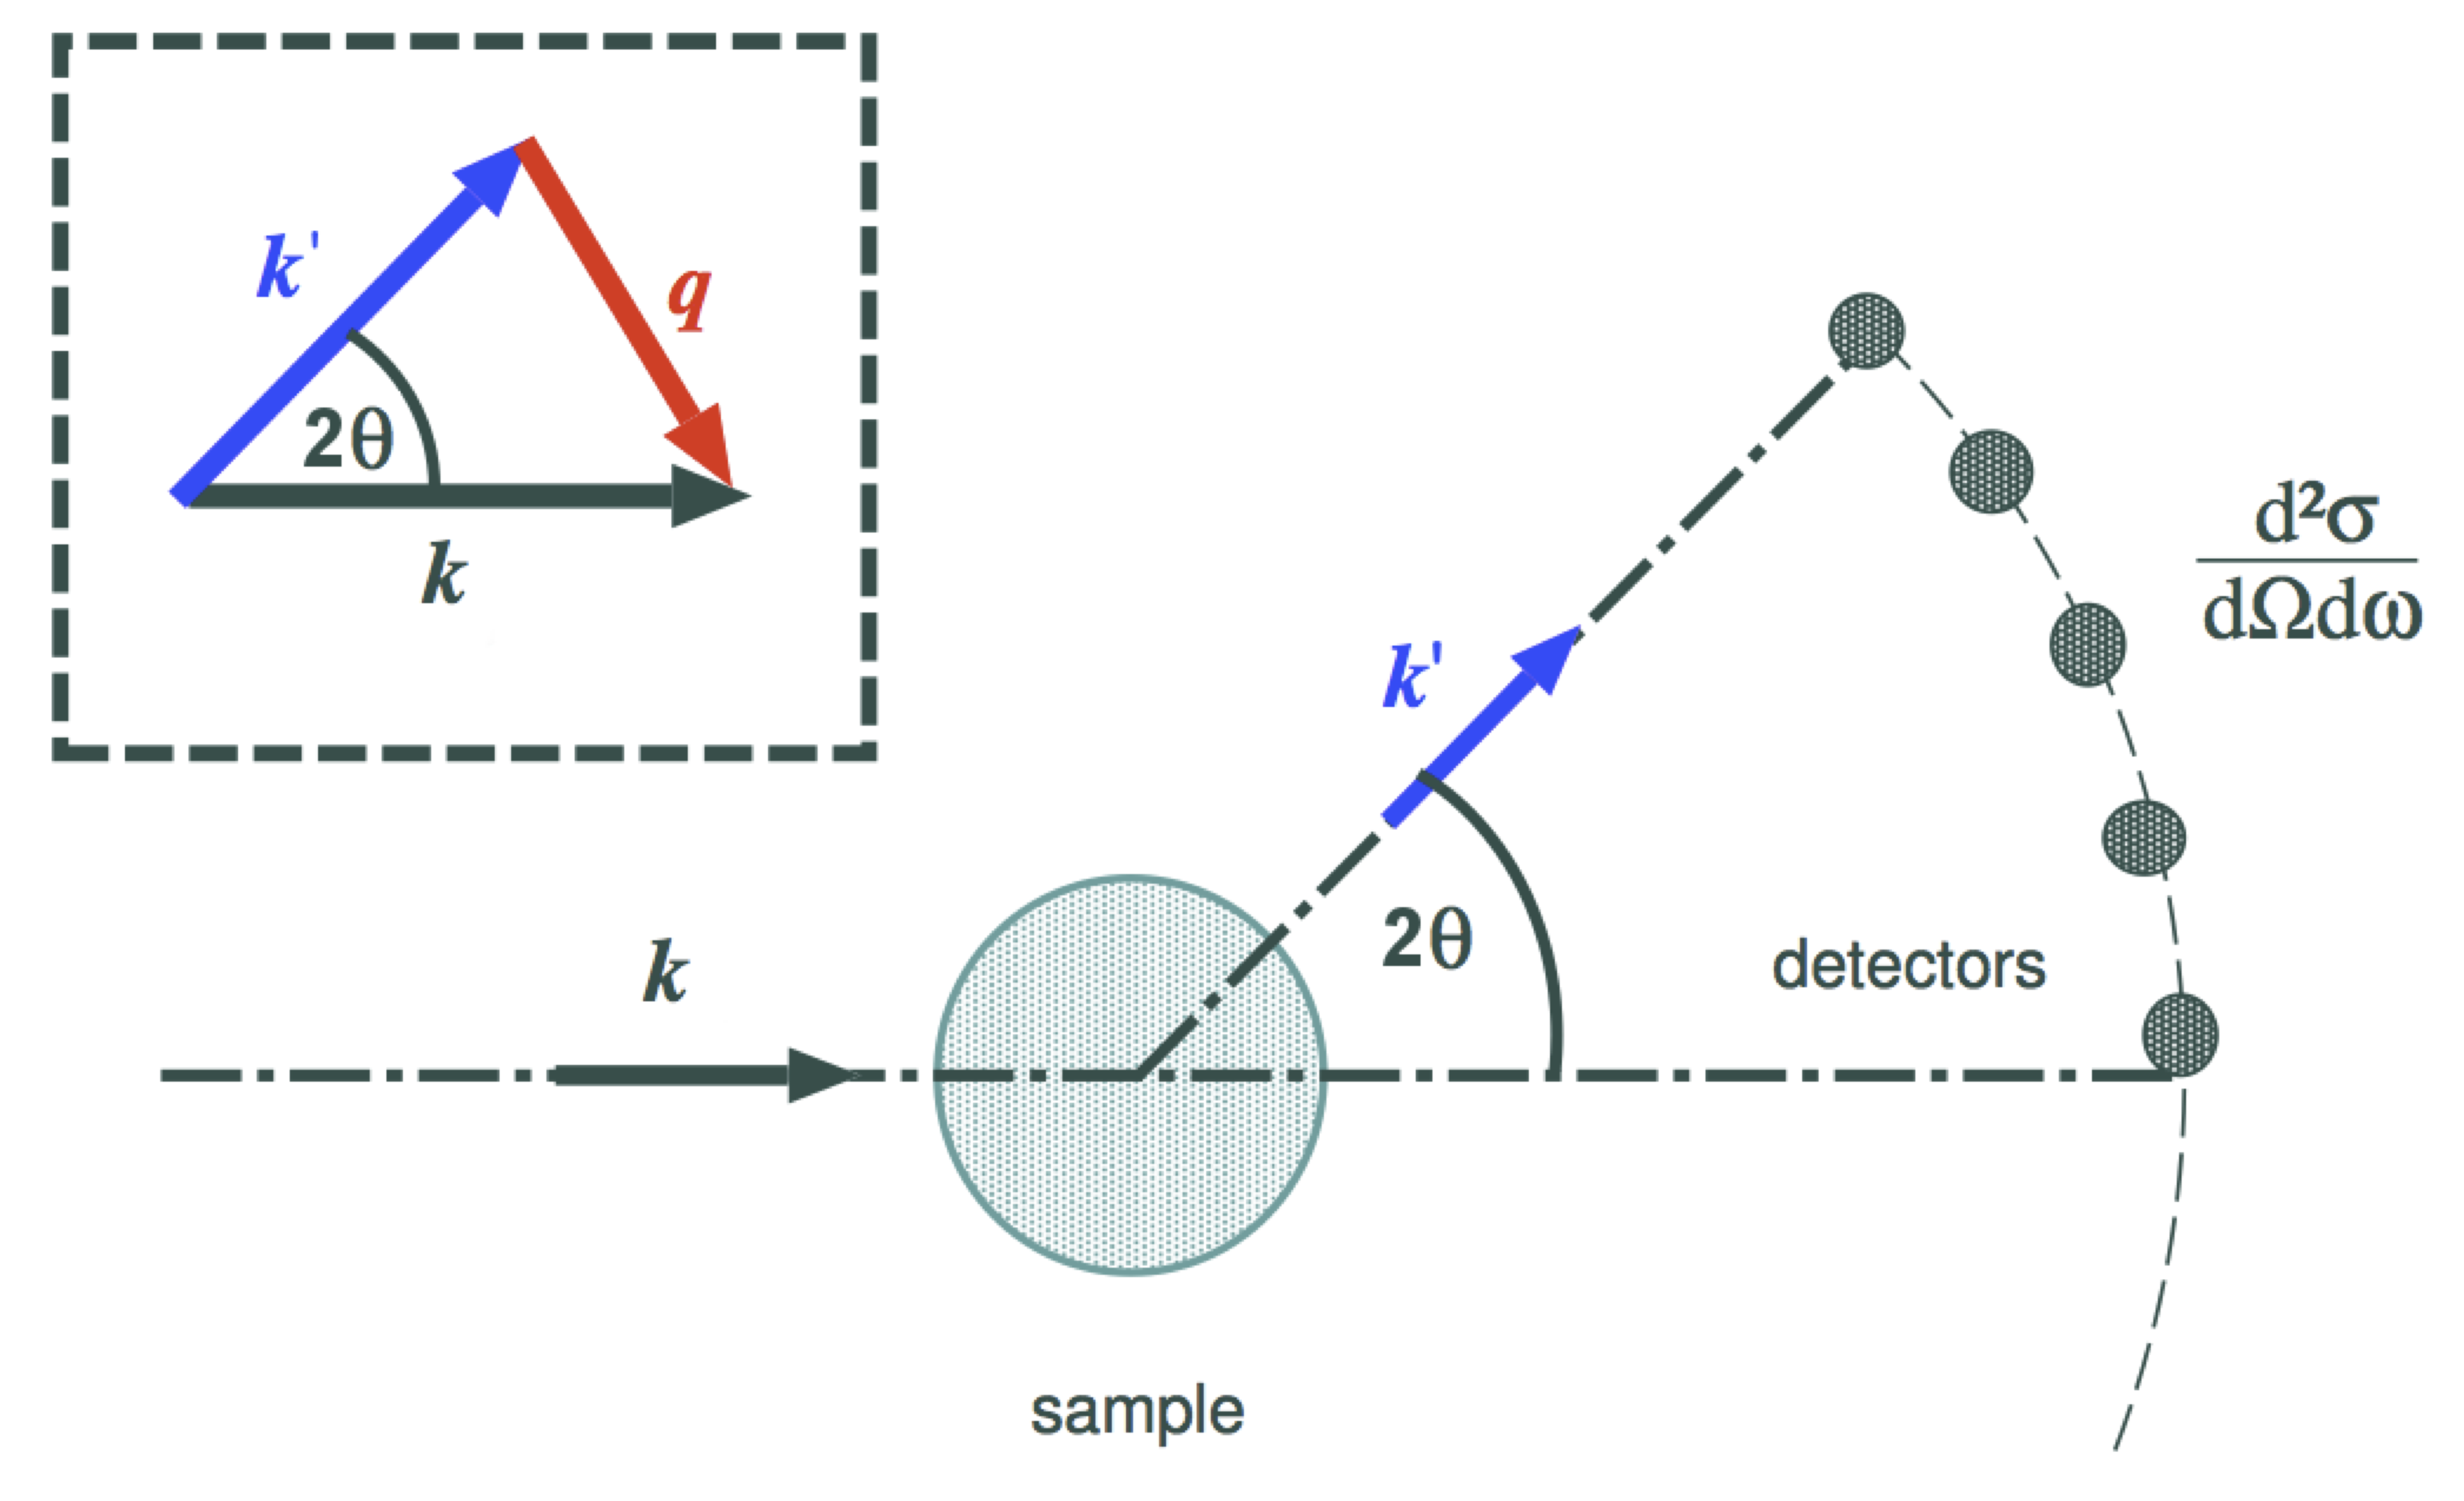
Figure 1: Schematic representation of a neutron scattering experiment. Inset: Scattering geometry. Figure from [1].

Experimental Setup

Figure 2: Schematic representation of the backscattering spectrometer IN10 at the ILL, Grenoble. Figure from [2].

Mainly, three types of spectrometers can be used for QENS:

  • Time-of-Flight spectrometers, in which the energy transfer of neutrons interacting with the sample are calculated from their time of arrival to the detectors;
  • Backscattering spectrometers, in which only those neutrons, which after interacting with the sample have a very well defined energy (typically ca. 2 meV) are scattered back from the so-called analyzers to the detectors. Figure 2 is a schematic representation of the backscattering spectrometer IN10 at the Institut Laue-Langevin (ILL);
  • Spin-Echo spectrometers, which measure small changes in neutron velocities very precisely by analyzing how their spins precess - while passing through a magnetic field - before and after interaction with the sample.

More details can be found on the web-page of the TOF/HR group of the ILL.


Example

Figure 3: Example of a spectrum S(ω) (symbols) collected at BASIS, fit and the various contributions to it (lines).

Recent QENS experiments have been performed on aqueous (D2O) solutions of a model protein, bovine serum albumin (BSA), on the backscattering spectrometer BASIS, at the Oak Ridge National Laboratory (ORNL). The aim of such experiments is to investigate self-dynamics of proteins in solution, as a function of protein concentration, salt (YCl3) concentration and temperature.
Figure 3 shows one of the measured spectra. The total spectrum (red circles) is a superposition of several contributions, such as global protein diffusion Lγ and protein internal motions LΓ.

References

[1] M. Grimaldo, F. Roosen-Runge, F. Zhang, F. Schreiber, and T. Seydel. Dynamics of proteins in solution. Quart. Rev. Biophys. 52 (2019) e7, 1

[2] F. Roosen-Runge, M. Hennig, F. Zhang, R. M.J. Jacobs, M. Sztucki, H. Schober, T. Seydel, and F. Schreiber. Protein self-diffusion in crowded solutions. PNAS 108 (2011) 11815

Research conducted at ORNL's Spallation Neutron Source was sponsored by the Scientific User Facilities Division, Office of Basic Energy Sciences, US Department of Energy.